Advanced Customization
This chapter helps you to personalize your rTorrent experience, specifically regarding the ncurses terminal user interface. It provides some background on the standard configuration, and how you can tweak it further according to your preferences.
Color Scheme Configuration
This section describes how you can change all the colors in rTorrent-PS to your liking.
Note that there are existing color schemes provided by the pyrocore configuration,
and you can rotate through them using the ~ key thanks to rtorrent.d/theming.rc.
You can copy one of the provided color scheme *.rc.default files in ~/.pyroscope/color-schemes/
to a new ‹mytheme›.rc file.
Details about how to specify colors and so on are in the sub-sections that follow.
Color Configuration Details
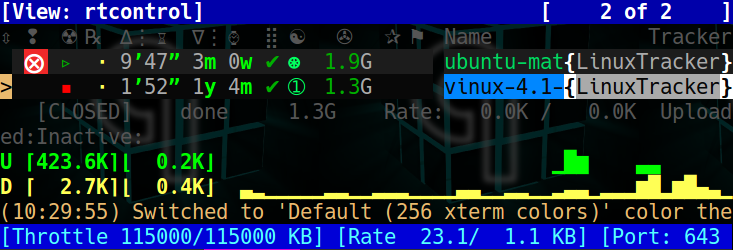
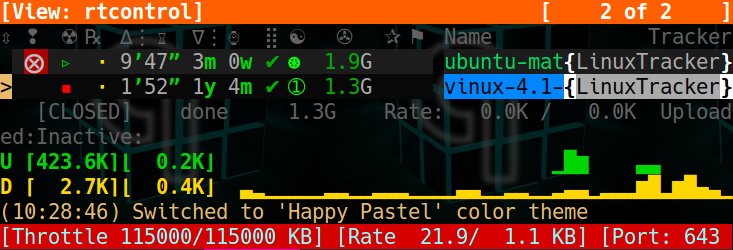
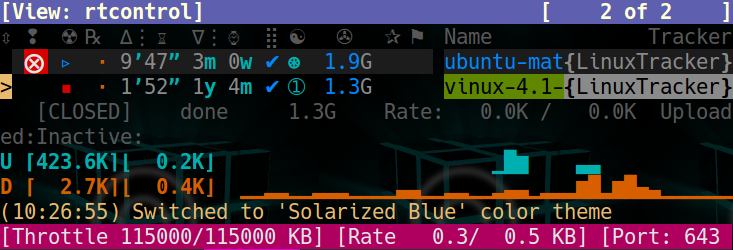
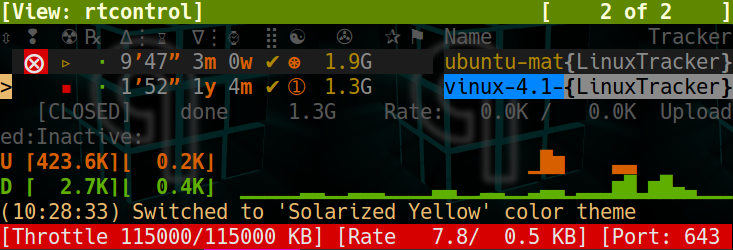
And here are some visuals of the default schemes…
Working With Color Schemes
If your terminal works as intended,
you now might want to find you own color theme.
The easiest way is to use a second shell and rtxmlrpc. Try
out some colors, and add the combinations you like to your
~/.rtorrent.rc.
# For people liking candy stores...
rtxmlrpc ui.color.title.set "bold magenta on bright cyan"
You can use the following code in a terminal to dump a full color scheme from the running client:
for i in $(rtxmlrpc system.listMethods | egrep '^ui.color.[^.]+$'); do
    echo $i = $(rtxmlrpc -r $i | tr "'" '"') ;
done
Adding Your Own Color Schemes
Color schemes are lists of ui.color.‹color name›.set commands in your configuration,
or in a *.rc[.default] file in the ~/.pyroscope/color-schemes/ directory.
If you want to use scheme rotation at all (via the ~ key),
put your own schemes into extra color-schemes/*.rc files and not the main configuration.
The set of color names is predetermined and refers to the meaning of the color,
i.e. where it is used on the canvas. footer and alarm are obvious examples.
Here’s a configuration example showing all the commands and their defaults:
# UI/VIEW: Colors
ui.color.alarm.set="bold white on red"
ui.color.complete.set="bright green"
ui.color.even.set=""
ui.color.focus.set="reverse"
ui.color.footer.set="bold bright cyan on blue"
ui.color.incomplete.set="yellow"
ui.color.info.set="white"
ui.color.label.set="gray"
ui.color.leeching.set="bold bright yellow"
ui.color.odd.set=""
ui.color.progress0.set="red"
ui.color.progress20.set="bold bright red"
ui.color.progress40.set="bold bright magenta"
ui.color.progress60.set="yellow"
ui.color.progress80.set="bold bright yellow"
ui.color.progress100.set="green"
ui.color.progress120.set="bold bright green"
ui.color.queued.set="magenta"
ui.color.seeding.set="bold bright green"
ui.color.stopped.set="blue"
ui.color.title.set="bold bright white on blue"
See the ui.color.* command reference for details on these and related commands.
The following color settings work better than the default ones in a 256 color terminal (gnome-terminal), for me at least. Your mileage (color table) may vary. Having 256 colors means you have very dark shades of grey, and that is used here to set the even / odd backgrounds.
ui.color.complete.set=41
ui.color.stopped.set=33

ui.color.footer.set="bright cyan on 20"
ui.color.even.set="on 234"
ui.color.odd.set="on 232"

ui.color.progress0.set=196
ui.color.progress20.set=202
ui.color.progress40.set=213
ui.color.progress60.set=214
ui.color.progress80.set=226
ui.color.progress100.set=41
ui.color.progress120.set="bold bright green"
Note that you might need to enable support for 256 colors in your
terminal, see Supporting 256 or More Colors for a description. In a nutshell, you need to
install the ncurses-term package if you don’t have it already, and
also add these commands to your rTorrent start script:
if [ "$TERM" = "${TERM%-256color}" ]; then
    export TERM="$TERM-256color"
fi
Customizing the Display Layout
Canvas v2 Topics
Canvas v2 Overview
The main display with the downloads list is flexible and can be configured to your will, in rTorrent-PS 1.1 and up. This is also known as canvas v2.
Use the following rtxmlrpc command to check if you have a version that can do this:
$ rtxmlrpc "system.has=,canvas_v2"
1
# The '1' means you have canvas v2 on board;
# a '0' or "Method 'system.has' not defined" means you don't.
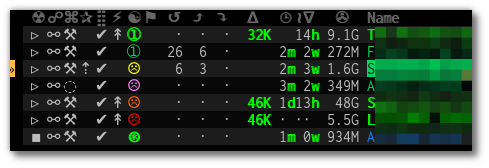
The only fixed parts are the position indicator at the very left of the display, and the combined name / tracker column on the right. The latter takes all the space left by other columns.
Inspecting Your Display
To list the columns you have in your setup, call rtxmlrpc like so:
$ rtxmlrpc method.get=,ui.column.render | sed -re 's/ /␣/g' | sort
100:3C95/2:❢␣␣
110:2C92/2:☢␣
120:?2:☍␣
130:?2:⌘␣
400:?3C23/3:␣↺␣
410:?3C24/3:␣⤴␣
420:?3C14/3:␣⤵␣
500:?2:⚡␣
510:3C28/3:℞␣␣
520:6C96/6:∆⋮␣⌛␣␣
530:6C90/6:∇⋮␣⌚␣␣
800:3:⋉␣
900:?5C24/3C21/2:␣Σ⇈␣␣
910:2C94/2:⣿␣
920:3C93/3:☯␣␣
930:5C15/3C21/2:␣✇␣␣␣
970:2C91/2:✰␣
980:2C16/2:⚑␣
The important thing here are the numbers in front, which define the sort order of columns from left to right. They also allow to address a specific column, which becomes important in a moment.
All these are built-in defaults, except the throttle indicator ⋉ with index 800,
which is defined in ~/rtorrent/rtorrent.d/05-rt-ps-columns-v2.rc.include of pimp-my-box.
Important
You MUST update your pimp-my-box configuration if you used that to set up your system. Otherwise you’ll get duplicate columns.
To show the full column definitions with their code, call pyroadmin:
$ pyroadmin --dump-rc | grep -A1 ui.column.render | egrep '^(method.set_key|    )'
method.set_key = ui.column.render, "100:3C95/2:❢  ", \
    ((array.at, {"  ", "♺ ", "⚠ ", "◔ ", "⚡ ", "↯ ", "¿?", "⨂ "}, ((d.message.alert)) ))
method.set_key = ui.column.render, "110:2C92/2:☢ ", \
    ((string.map, ((cat, ((d.is_open)), ((d.is_active)) )), {00, "▪ "}, …, {11, "▹ "}))
…
method.set_key = ui.column.render, "980:2C16/2:⚑ ", \
    ((array.at, {"  ", "⚑ "}, ((d.views.has, tagged)) ))
Column Layout Definitions
The keys of the ui.column.render multi-command must follow a defined format,
namely ‹index›:〈?〉‹width›〈‹color definition›〉:‹title›.
There are three fields, separated by colons.
The parts in 〈…〉 are optional.
‹index› was already mentioned, used for sorting and addressing columns.
The second field can start with a ? to tag this column as ‘sacrificial’,
i.e. optional in the face of too narrow terminals.
‹width› is a column’s width in characters.
The ‹color definition› determines what terminal attributes are used to render these characters,
and is a sequence of C‹color index›/‹length› elements.
Finally, ‹title› is used for the column’s heading.
Make sure to end it with a space to leave room for wide Unicode glyphs,
and always make it as long as the column width.
To get a color index table, try this command:
rtxmlrpc system.has.private_methods \
    | egrep '^ui.color.*index$' \
    | xargs -I+ rtxmlrpc -i 'print="+ = ",(+)'
Since the ui.color.*index commands are private, the output must go to the rTorrent console.
This is what you’ll see (timestamps removed):
ui.color.alarm.index = 22
ui.color.complete.index = 23
ui.color.custom1.index = 1
ui.color.custom2.index = 2
ui.color.custom3.index = 3
ui.color.custom4.index = 4
ui.color.custom5.index = 5
ui.color.custom6.index = 6
ui.color.custom7.index = 7
ui.color.custom8.index = 8
ui.color.custom9.index = 9
ui.color.even.index = 30
ui.color.focus.index = 19
ui.color.footer.index = 18
ui.color.incomplete.index = 27
ui.color.info.index = 21
ui.color.label.index = 20
ui.color.leeching.index = 28
ui.color.odd.index = 29
ui.color.progress0.index = 10
ui.color.progress20.index = 11
ui.color.progress40.index = 12
ui.color.progress60.index = 13
ui.color.progress80.index = 14
ui.color.progress100.index = 15
ui.color.progress120.index = 16
ui.color.queued.index = 26
ui.color.seeding.index = 24
ui.color.stopped.index = 25
ui.color.title.index = 17
There are also columns with dynamic color schemes, using a color index ≥ 90,
which map to a ‘normal’ color index depending on an item’s attributes.
An example is 3C95/2 for the alert column,
which changes to red (ui.color.alarm) if there is an active alert.
This is a list of the dynamic color schemes:
- 90:
DOWN_TIME– Download (∇ leeching) or time display (⌚ info + seeding/incomplete)- 91:
PRIO– A color for ✰, depending ond.priority: progress0, progress60, info, progress120- 92:
STATE– A color for ☢, depending ond.is_open(progress0 if not) andd.is_active(progress80 or progress100)- 93:
RATIO– A progress color for ☯ from 0 to 120- 94:
PROGRESS– A progress color from 0 to 100 for the ⣿ column- 95:
ALERT– For ❢, info or alarm depending on alert state- 96:
UP_TIME– Upload (∆ seeding) or time display (⌛ info + seeding/incomplete)
The mixed DOWN_TIME and UP_TIME schemes must span the full width of the column,
and can only be used with one color definition in the column key (anything after them is ignored).
Defining Your Own Columns
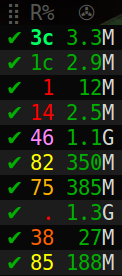
This example shows how to replace the ratio column (920) with a pure ASCII version. You can see the result on the right.
Place this code in your custom configuration,
e.g. in the _rtlocal.rc file (when using pimp-my-box).
# Remove the default column
method.set_key = ui.column.render, (ui.column.spec, 920)

# Add ASCII ratio in percent
# (1..99 for incomplete; 1c = 1.0; 1m = 10.0; …)
method.set_key = ui.column.render, "922:3C93/3:R% ", \
    ((string.replace, ((convert.magnitude, ((math.div, ((d.ratio)), 10)) )), \
                      {"⋅", "."} ))
To construct a column definition like this, you need to understand rTorrent Scripting first – more so than what’s sufficient for writing simple configurations.
Looking at the original column definition often helps, e.g. to grab a few snippets for your own version:
$ pyroadmin --dump-rc | egrep -A1 '"920:.+"'
method.set_key = ui.column.render, "920:3C93/3:☯  ", \
    ((string.substr, "☹ ➀ ➁ ➂ ➃ ➄ ➅ ➆ ➇ ➈ ➉ ", \
                     ((math.mul, 2, ((math.div, ((d.ratio)), 1000)) )), 2, "⊛ "))
Also, try to understand how all the other column definitions work, you can learn a few tricks that are typical for column rendering.
Especially if you want to display additional values in the same format as an existing column,
you just have to swap the command accessing the displayed item’s data.
Here’s a chunk size column, all you need to do is
replace d.size_bytes in the code of column 930 with d.chunk_size,
and give it a new index and heading.
ui.color.custom9.set = "bright blue"
method.set_key = ui.column.render, "935:5C9/3C21/2: ≣   ", \
    ((convert.human_size, ((d.chunk_size)) ))
That example also shows how to use a custom color.
Disabling Columns
The ui.column.show and ui.column.hide commands provide the means to
easily change the visibility of columns, without touching their definition.
They both take a list of column keys as their arguments, as either strings or values.
The following example shows column ♯42 only on the active and leeching views,
method.set_key = event.view.show, ~column_42_toggle, \
    "branch = \"string.contains=$ui.current_view=, active, leeching\", \
        ui.column.show=42, ui.column.hide=42"
ui.column.hide = 42
The ui.column.is_hidden and ui.column.hidden.list commands can be used to query the visibility of columns,
the first one takes a single column key as its argument.
$ rtxmlrpc --repr ui.column.is_hidden '' 42
1
$ rtxmlrpc --repr ui.column.hidden.list
[42]
A practical use of ui.column.is_hidden is to toggle a column.
This code does so for ♯935, and binds the toggle to the _ key.
method.insert = pmb._toggle_chunk_size, simple|private, \
    "branch = ui.column.is_hidden=935, ui.column.show=935, ui.column.hide=935 ; \
     ui.current_view.set = (ui.current_view)"
pyro.bind_key = toggle_chunk_size, _, "pmb._toggle_chunk_size="
The ui.current_view.set = (ui.current_view) part forces a redraw of the canvas,
giving you instant feedback.
Adding Traffic Graphs
Add these lines to your configuration:
# Show traffic of the last hour
network.history.depth.set = 112
schedule = network_history_sampling,1,32, network.history.sample=
method.insert = network.history.auto_scale.toggle, simple|private, \
    "branch=network.history.auto_scale=, \
        \"network.history.auto_scale.set=0\", \
        \"network.history.auto_scale.set=1\""
method.insert = network.history.auto_scale.ui_toggle, simple|private, \
    "network.history.auto_scale.toggle= ;network.history.refresh="
branch=pyro.extended=,"schedule = bind_auto_scale,0,0, \
    \"ui.bind_key=download_list,=,network.history.auto_scale.ui_toggle=\""
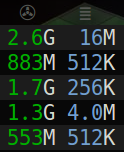
And you’ll get this in your terminal:

rTorrent-PS Network History
As you can see, you get the upper and lower bounds of traffic within
your configured time window, and each bar of the graph represents an
interval determined by the sampling schedule. Pressing = toggles
between a graph display with a baseline of 0, and a zoomed view that scales
it to the current bounds.